Improve Inflation Forecasts With BERT
Using a fine-tuned language model to extract measures of economic activity in order to improve inflation forecasts.
This post overviews one of my undergraduate dissertations. This dissertation investigated using a fine-tuned foundation model to extract proxies for economic indicators from naturally-occuring text data. This is of interest since leveraging transfer learning could plausibly allow us to extract high-fidelity measurements of economic phenomena that would otherwise be too expensive or too impractical to obtain. I focused on extracting measures of economic sentiment - since consumer and producer sentiment is usually measured through infrequent surveys that only imperfectly capture the desired phenomenon - for use in improving inflation forecasts in Nigeria. The measures of economic sentiment I constructed were taken from the headlines of all major Nigerian newspapers over a 10 year period.
Background
Before outlining this project in further detail, it is useful to first briefly overview why we would expect newspaper headlines to improve inflation forecasts. One reason for this is that, empirically, newspaper sentiment has already been used to improve forecasts of macroeconomic indicators in countries like the UK (Kalamara et al., 2022) and USA (Shapiro et al., 2022). Interestingly, these past studies use “old school” NLP methods (e.g. applying sentiment dictionaries or constructing sentiment classification models from scratch) such that we might expect even better results when using a fine-tuned foundation model to extract sentiment. A second reason is that there are many theoretical reasons why newspaper sentiment ought to be useful for forecasting inflation. A few such theoretical arguments are as follows:
- A first reason that positive economic reporting should correspond to a growing economy and high levels of economic activity which, according to economic theory, should be associated with low and stable inflation (Bernanke, 2006). Similarly, negative reporting should be associated with higher inflation due to it being on average associated with worse economic conditions.
- The second reason to expect newspaper sentiment to relate to inflation is that consumer sentiment – that is, consumer attitudes towards the economy - is influenced by it (Starr, 2012). One way this influence can occur is by newspapers conveying economic facts to individuals such that, for example, positive facts improve consumer sentiment (Doms & Morin, 2004). Another way it can occur is by the tone with which newspapers report on economic events generating narratives about the economy that are repeated to individuals by peers and by other news sources (Shiller, 2017). These narratives can then generate animal spirits whereby consumer sentiment of many individuals change in one direction (Keynes, 1936). If newspaper sentiment influences consumer sentiment through then it should be associated with consumer behaviour and, consequently, inflation.
Methodology
Attention can now turn to the methodology used to test whether newspaper sentiment extracted in this way improves Nigerian inflation forecasts.
Data
This is tested using data from January 2012 to December 2022 as this is the longest period for which relevant data is available. The relevant data comes from two sources. The first is the monthly year -on -year inflation rate gathered from the Central Bank Of Nigeria statistical database. This tracks the percentage change in the Nigerian Consumer Price Index (CPI) - which measures the cost of an average Nigerian basket of goods and services– relative to 12 months prior.
The second source of data is a dataset of Nigerian newspaper articles downloaded from the LexisNexis repository. The dataset contains the economic newspaper articles published by 9 major English-language Nigerian newspapers. These are The Daily Independent, The Nation, Nigerian Tribune, PM News, The Sun, This Day, Vanguard, Daily Trust and Leadership. LexisNexis contains articles from 5 of these papers (The Sun, This Day, Vanguard, Daily Trust and Leadership) for the whole study period. However, PM news is only available from October 21st 2013, The Nation from December 31st 2013, Nigerian Tribune from February 4th 2014 and The Daily Independent from July 11th 2015. These newspapers represent a large chunk of the Nigerian newspaper market. This data was acquired by downloading all articles published by the 9 papers from January 1st 2012 to December 31st 2022 that were tagged on LexisNexis as relating to the “economy or economic indicators” topic. After removing duplicates, this produced 152,521 articles. However, some articles didn’t relate to Nigeria. As such, articles mentioning another country but not referencing Nigeria were dropped under the assumption they wouldn’t contain sentiment relevant to inflation forecasting. An article was taken to contain a reference to Nigeria if it mentioned Nigeria, any Nigerian state, the capital of any Nigerian state, or anyone who was president or vice- president of Nigeria, or governor of the Central Bank of Nigeria, during the period. This led to 148,949 articles. Of these, 3,000 were randomly set aside to fine-tune the BERT model with, leaving 145,949 for which sentiment could be extracted for use in forecasting. Finally, the headline from each article is extracted and all other text is deleted. This is because, to be able to fine-tune the BERT model, the 3000 fine-tuning examples had to be manually read and labelled according to the sentiment they expressed. Manually reading and labelling 3000 articles was impractical while doing this for 3000 headlines was not. As such, the BERT model learns to classify sentiment in headlines and not whole articles. Given this, the text from which sentiment is extracted for forecasting purposes is the headlines. However, as headlines summarise articles, sentiment in headlines should reflect that in articles and this should not affect any findings
Fine-Tuning BERT
This paper classifies sentiment in headlines using transfer learning with a BERT foundation model. As explained, a BERT model is a machine- learning model that has been pre- trained on the tasks of predicting missing words in sentences and of predicting whether two sentences follow each other in a text (Devlin et al., 2019). Transfer learning in this context refers to fine-tuning a pre-trained BERT model to classifying the sentiment in Nigerian economic headlines.
As mentioned, 3,000 headlines were set aside from the main dataset. These headlines were manually read and had their sentiment labelled by the researcher as expressing positive, negative or neutral sentiments. The BERT model that was used as a foundation model and that was fine-tuned to predict the sentiments in these headlines is a BERT model called FinBERT. FinBERT is pre-trained to predict missing words and predict whether two sentences follow each other using financial and economic text such as financial analyst reports (Huang et al., 2023). As such, FinBERT has a baseline understanding of language in economic contexts. FinBERT was fine-tuned to classify the sentiment of 2,700 of these labelled headlines with 300 being set aside as a validation set.
In order to validate that the fine-tuned model had learned to accurately classify sentiment in Nigerian economic headlines, 300 of the 3,000 labelled headlines were not used for fine-tuning. The model’s ability to correctly classify the sentiment of these unseen headlines should hence reflect its ability to classify the sentiment of the headlines in the forecasting dataset. Of these 300 unseen headlines, the fine-tuned model correctly classified the sentiment of 226, corresponding to an accuracy of 75.3%. For comparison, a popular dictionary method called VADER (Hutto & Gilbert, 2014) was also used to classify these headlines. VADER correctly classified 146, achieving the lower accuracy of 48.3%. The fine-tuned BERT model was judged to be sufficiently accurate and so was used to classify the remaining 145,949 headlines as expressing positive, negative or neutral sentiment.
Constructing A Measure Of News Sentiment
To use this extracted sentiment to forecast monthly inflation it had to be converted into monthly variables. Variables were created that represented the portion of headlines in a month that were classified as expressing positive or negative sentiments. These variables were then transformed into the variables \(PCTPOS_t\) and \(PCTNEG_t\) that were used to forecast inflation by taking a 3 month rolling average. As such, \(PCTPOS_t\) represents the average monthly portion of headlines that were classified as positive over the past 3 months at month t. \(PCTNEG_t\) is the analogous quantity for the monthly share of negative headlines. Taking a rolling average is standard practice for sentiment data since sentiment from prior months is informative for forecasting. As the sentiment data starts in January 2012, taking a 3 month rolling average means data exist for \(PCTPOS_t\) and \(PCTNEG_t\) for the 130 months from March 2012 to December 2022.
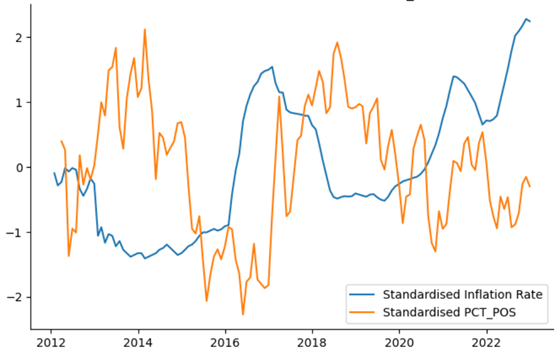
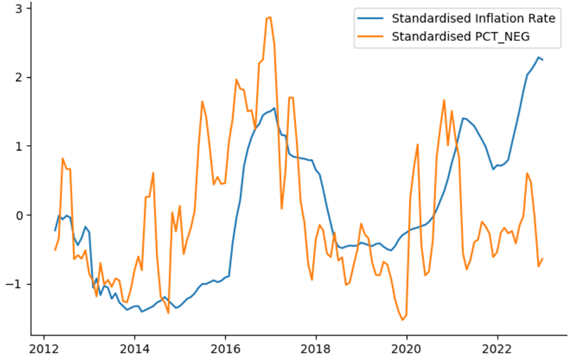
The below figures plot the standardised value of the Nigerian monthly inflation rate from March 2012 to December 2022 against the respective standardised value of \(PCTPOS_t\) and \(PCTNEG_t\). These figures illustrate that both variables behave as expected, with \(PCTPOS_t\) moving in the opposite direction to inflation on average (correlation of -0.350) and \(PCTNEG_t\) moving in the same direction as inflation on average (correlation of 0.365). Additionally, Nigeria experienced a major recession in 2016 which is reflected as a spike in \(PCTNEG_t\) and a dip in \(PCTPOS_t\) during 2016.
Forecasting Inflation
Having outlined how newspaper sentiment was extracted and turned into variables, attention can now turn to the method used to test whether these variables improved Nigerian inflation forecasts. To test a time series model’s inflation forecasting ability, we cannot look at its predictive ability during the period on which its parameters were estimated. This is because the model’s parameters will have been estimated precisely to explain variation in inflation over that period, and this may not accurately represent future variation in inflation. As such, a model’s ability to predict the inflation for this period won’t represent its ability to forecast future inflation. Instead, we must look at its ability to forecast inflation during a period in which it was not estimated. This is called out-of-sample forecasting.
This paper tested whether the sentiment variables improved inflation forecasts by comparing out-of-sample forecasts from two types of basic models. The first, referred to as the baseline, is:
\[\pi_{t+h} = \alpha + \beta \pi_t + \epsilon_t\]and the second, referred to as the augmented model, augments the baseline model with one of the sentiment variables:
\[\pi_{t+h} = \alpha + \beta \pi_t + \gamma S_t + \epsilon_t\]In these models, \(\pi_t\) is the inflation rate for month \(t\), \(S_t\) denotes either \(PCTPOS_t\) or \(PCTNEG_t\), \(\epsilon_t\) is an error term, and \(h\) is the forecasting horizon, or the number of months ahead that we seek to predict inflation. The latter model seeks to explain inflation at month \(t+h\) using both the inflation rate and sentiment at month \(t\), while the former seeks to explain inflation at month \(t+h\) using only the inflation rate at month \(t\).
The procedure used to compare the out-of-sample forecasts of the two models when predicting inflation \(h\) months into the future is as follows. Both models are estimated using a 36-month rolling window scheme. This means that they are continually re-estimated using a 36-month long dataset that shifts through time such that models are first estimated by using data from month 1 (March 2012) to month 36 to explain inflation from month 1+h to month 36+h. They are then re-estimated by using data from month 2 to month 37 to explain inflation from month 2+h to month 37+h, and so on as a 36-month long window shifts along month by month.
After the two models are estimated on each data window, they are both used to produce an out-of-sample forecast. To understand how this works, suppose a model is estimated by using data from month \(j\) to month \(j+35\) to explain inflation from month \(j+h\) to month \(j+35+h\). This model will be used to produce an out-of-sample forecast for month \(j+36+h\) using data from month \(j+36\). This corresponds to forecasting inflation \(h\) months ahead for the month \(j+36\) that directly follows the end of the data window used to estimate the model. This produces a forecasted inflation rate for month \(j+36+h\) of \(\hat{\pi}_{\text{base},j+36+h}\) for the baseline model and \(\hat{\pi}_{\text{aug},j+36+h}\) for the augmented model. These forecasts can be compared to the true inflation rate \(\pi_{j+36+h}\) for that month such that we can define the forecast error in month \(j+36+h\) for the baseline model to be:
\[e_{\text{base},j+36+h} = \hat{\pi}_{\text{base},j+36+h} - \pi_{j+36+h}\]and the forecast error for the augmented model to be:
\[e_{\text{aug},j+36+h} = \hat{\pi}_{\text{aug},j+36+h} - \pi_{j+36+h}\]This repeats until the month \(j+36+h\) to be forecasted is the final month in the dataset (December 2022). This occurs when \(j+36+h\) equals 130 and results in forecast errors spanning 95-h months from month 36+h to month 130. The quality of the forecasts from each model can be summarized as a mean squared forecast error (MSFE), which is the average squared forecast error for the model. A lower MSFE corresponds to more accurate out-of-sample forecasts. For the baseline and augmented models respectively, the MSFE associated with forecasting inflation \(h\) months ahead are defined as:
\[\text{MSFE}_{\text{base}} = \frac{\sum_{i=36+h}^{130} (e_{\text{base},i})^2}{95-h} = \frac{\sum_{i=36+h}^{130} (\hat{\pi}_{\text{base},i} - \pi_i)^2}{95-h}\]And
\[\text{MSFE}_{\text{aug}} = \frac{\sum_{i=36+h}^{130} (e_{\text{aug},i})^2}{95-h} = \frac{\sum_{i=36+h}^{130} (\hat{\pi}_{\text{aug},i} - \pi_i)^2}{95-h}\]Finally, the Diebold-Mariano test (Diebold & Mariano, 1995) is applied. This tests the null hypothesis that the ratio of the augmented MSFE to the baseline MSFE is 1:
\[H_0: \frac{\text{MSFE}_{\text{aug}}}{\text{MSFE}_{\text{base}}} = 1\]Against the alternative that it isn’t:
\[H_1: \frac{\text{MSFE}_{\text{aug}}}{\text{MSFE}_{\text{base}}} \neq 1\]This ratio represents the size of the augmented MSFE relative to the baseline MSFE. A ratio of less than 1 means the augmented model has a lower MSFE and has produced better forecasts than the baseline model. The lower this ratio gets, the larger the improvement in forecast accuracy is when using the augmented model. If we reject the null and the ratio is less than 1, we hence have evidence to claim that the model augmented with a sentiment variable produces statistically better forecasts as its MSFE is lower than that of the baseline model by a statistically significant degree.
To summarize, the procedure used to test whether newspaper sentiment improves Nigerian inflation forecast is as follows. A baseline and an augmented model are used to produce a series of out-of-sample forecasts for inflation \(h\) months in the future. This generates an augmented MSFE and a baseline MSFE. The Diebold-Mariano test then tests whether the ratio of these is equal to 1. If the ratio is less than 1 and the test rejects the null, then we can claim the augmented model produces statistically better forecasts. This procedure is conducted for forecasting inflation 1, 3, 6, 9, and 12 months ahead and for both an augmented model containing the \(PCTPOS_t\) variable and an augmented model containing the \(PCTNEG_t\) variable.
Results
The results associated with using the baseline and respective augmented models to forecast inflation \(h\) months into the future are presented below. They also contain the ratio of the augmented MSFE to the baseline MSFE and the p-value associated with running the Diebold-Mariano test to check whether this ratio is statistically different from 1. Ratios that are found to be statistically significant in their difference from 1 are indicated. As stated above, if a ratio is both less than 1 and statistically different from 1, then there is sufficient evidence to claim that the augmented model produces more accurate forecasts.
Three key findings are clear when looking at the results. The most important finding is that, for all forecasting horizons and for both sentiment variables, the MSFE of the augmented model is lower than the MSFE of the baseline model by a statistically significant degree. Indeed, the p-values corresponding to the Diebold-Mariano test of equality of MSFEs for every horizon for both sentiment variables is equal to 0 to three decimal places. As such, every difference in MSFEs is statistically significant even at the restrictive 1% significance level. This provides strong evidence in support of the idea that newspaper sentiment can improve Nigerian inflation forecasts.
| h | $$MSFE_{base}$$ | $$MSFE_{aug}$$ | $$\frac{MSFE_{aug}}{MSFE_{base}}$$ | p-value |
|---|---|---|---|---|
| 1 | 0.292 | 0.166 | $$\mathbf{0.568^{***}}$$ | 0.000 |
| 3 | 2.243 | 1.094 | $$\mathbf{0.488^{***}}$$ | 0.000 |
| 6 | 7.353 | 3.435 | $$\mathbf{0.467^{***}}$$ | 0.000 |
| 9 | 12.126 | 5.079 | $$\mathbf{0.419^{***}}$$ | 0.000 |
| 12 | 14.927 | 4.901 | $$\mathbf{0.328^{***}}$$ | 0.000 |
Table 1: MSFEs of baseline model and model augmented with \(PCTPOS_t\), and p-value corresponding to the Diebold-Mariano test. All numbers rounded to 3 decimal places. Ratios whose difference from 1 is statistically significant are denoted * (10% significance), ** (5% significance), and ** (1% significance).*
| h | $$MSFE_{base}$$ | $$MSFE_{aug}$$ | $$\frac{MSFE_{aug}}{MSFE_{base}}$$ | p-value |
|---|---|---|---|---|
| 1 | 0.292 | 0.206 | $$\mathbf{0.703^{***}}$$ | 0.000 |
| 3 | 2.243 | 1.483 | $$\mathbf{0.661^{***}}$$ | 0.000 |
| 6 | 7.353 | 4.679 | $$\mathbf{0.636^{***}}$$ | 0.000 |
| 9 | 12.126 | 6.936 | $$\mathbf{0.572^{***}}$$ | 0.000 |
| 12 | 14.927 | 7.672 | $$\mathbf{0.514^{***}}$$ | 0.000 |
Table 2: MSFEs of baseline model and model augmented with \(PCTNEG_t\), and p-value corresponding to the Diebold-Mariano test. All numbers rounded to 3 decimal places. Ratios whose difference from 1 is statistically significant are denoted * (10% significance), ** (5% significance), and ** (1% significance).*
Additionally, some of the reductions in MSFEs are substantial. For instance, when forecasting inflation 12 months ahead, the augmented model’s MSFE is a mere 35.2% of the baseline model’s MSFE, which is a massive reduction in forecast error relative to the baseline model. The 12-month ahead forecasts corresponding to this baseline and augmented model are illustrated alongside the true inflation rate in the figure below. While still clearly imperfect, the inflation forecasted by the augmented model (orange) is significantly closer to the true inflation rate (blue) than what is predicted by the baseline model (green).
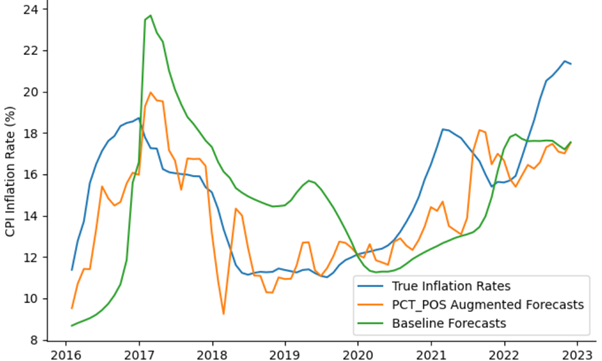
Figure: Inflation and forecasts made 12 months prior by baseline model and model augmented with \(PCTPOS_t\)
The second key finding is that the relative improvement in forecasting accuracy attained by adding one of the sentiment variables to the forecasting model appears to increase as we forecast inflation further into the future. We can see this by noting that the ratios of augmented to baseline MSFEs declines on average as the forecasting horizon increases. For instance, when forecasting inflation one month ahead using the positive sentiment variable this ratio is 0.582 while when forecasting 12 months ahead using the positive sentiment variable this drops to 0.352. This is a very interesting finding. If the newspaper sentiment variables were only related to future inflation through its association with current inflation, one would expect the augmented MSFE to, at best, increase at a similar pace to the baseline MSFE as the forecasting horizon increased such that ratio would stay constant. The fact that the ratios consistently decrease suggests that that the variables capture an economic phenomenon that is related to future inflation independent of the variables’ association with current inflation. A potential interpretation of this could be that, in addition to influencing current consumer sentiment, newspaper sentiment also generates economic narratives that unleashes animal spirits – that is, changes in collective consumer sentiment in the economy - but that take time to percolate through the economy.
The final major finding is that the positive sentiment variable appears to provide greater reductions in MSFE than the negative sentiment variable. This is because the ratio of the MSFEs is consistently lower when using the model augmented with the positive sentient variable. Figure 9 illustrates this for the 12 month horizon by plotting the 12 month ahead inflation forecasts generated by the model augmented with the positive sentiment variable (orange) and the model augmented by the negative sentiment variable (green) against the true inflation rates. As can be seen, the forecasts made by the later model are, on average, closer to the truth than the those produced by the former model. Exactly why this pattern emerges is unclear. One possible explanation could be that consumer sentiment is more effected by positive newspaper sentiment than negative sentiment.
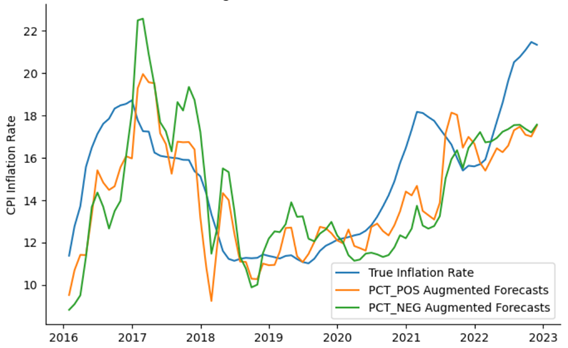
Figure: Inflation and forecasts made 12 months prior by model augmented with \(PCTPOS_t\) and model augmented with \(PCTNEG_t\)
Conclusion
This project aimed to understand the extent to which newspaper sentiment extracted via transfer learning could be used to improve Nigerian inflation forecast. It did this by using transfer learning with the FinBERT foundation model to extract sentiment from Nigerian economic newspaper headlines. This sentiment was converted into monthly variables which were then used to augment a basic time series model for forecasting Nigerian inflation. The forecasts produced by these augmented models were compared to the forecasts produced by simpler models in order to test whether models augmented with sentiment extracted from headlines produced statistically better inflation forecasts. Three key results were found. First, forecasts produced using models augmented sentiment were found to be significantly better than forecasts produced by the baseline model for every forecasting horizon considered. This provides strong evidence in favour the idea that newspaper sentiment extracted with transfer learning can improve Nigerian inflation forecasts. Second, the improvement in forecast accuracy associated with including this sentiment in a model appeared to increase the further into the future the models were forecasting inflation. Finally, positive newspaper sentiment seemed to be able to improve forecast quality by more than negative sentiment.
References
2023
- FinBERT: A Large Language Model for Extracting Information from Financial TextContemporary Accounting Research, 2023
2022
- Making text count: Economic forecasting using newspaper textJournal of Applied Econometrics, 2022
-
2019
- BERT: Pre-training of Deep Bidirectional Transformers for Language Understanding2019
2017
- Narrative EconomicsAmerican Economic Review, Apr 2017
2014
- VADER: A Parsimonious Rule-Based Model for Sentiment Analysis of Social Media TextProceedings of the International AAAI Conference on Web and Social Media, May 2014
2012
2006
2004
1995
1936
- The General Theory of Employment, Interest and MoneyMay 193614th edition, 1973